Parkscore
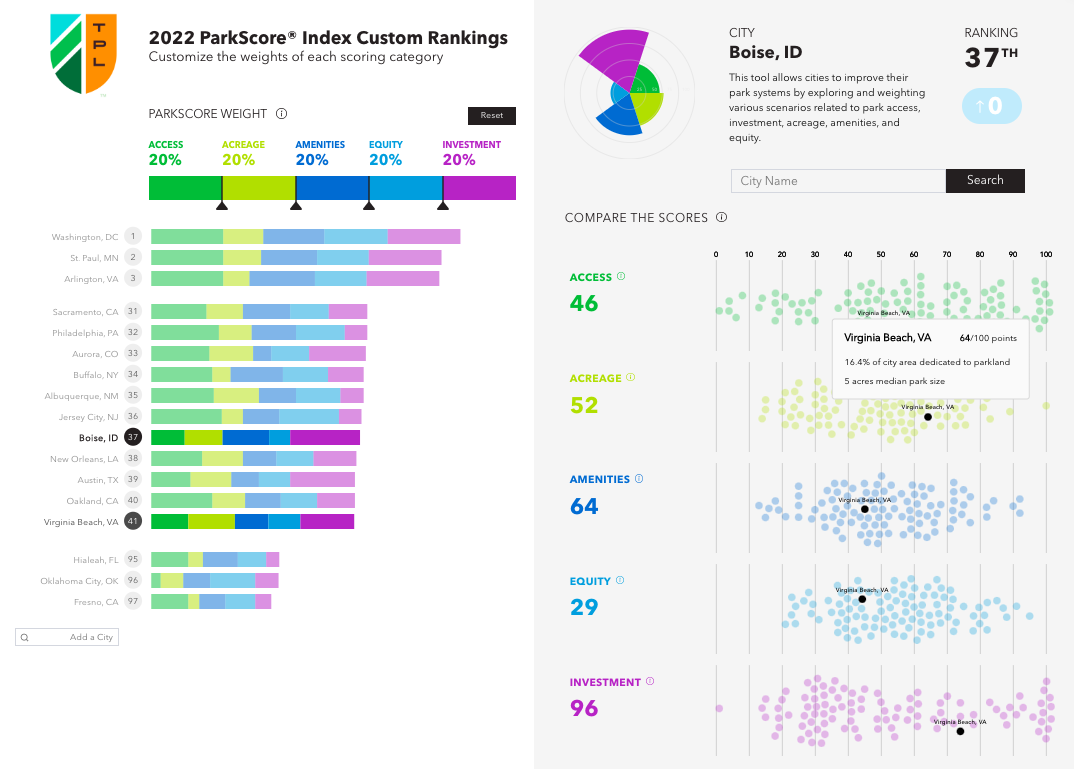
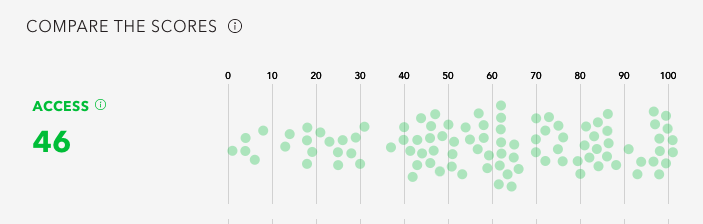
An interactive dashboard for cities to learn how they can improve their park systems. With bespoke data visualizations and tools, the final product conveys maximum information in a single screen.
I was the technical lead of the Schema Design team in managing data, analyzing visualization opportunities, developing and prototyping the visualizations, and building the final website.
You can view the piece here.